
· 9 min read
TL;DR:

dlt uses Apache Arrow to make pipelines faster. The Arrow format is a better way to represent tabular data in memory than native Python objects (list of dictionaries). It enables offloading computation to Arrow’s fast C++ library, and prevents processing rows one by one.

Speed matters. Pipelines should move data quickly and efficiently. The bigger the data, the more that holds true. Growing data volumes force performance optimization upon data processing tools. In this blog I describe how dlt uses Arrow and why it makes data pipelines faster.

What is dlt?

dlt is an open source Python library that lets you build data pipelines as code. It tries to make data movement between systems easier. It gives data engineers a set of abstractions (e.g. source, destination, pipeline) and a declarative API that saves them from writing lower level code.

dlt doesn’t use a backend server/database. It’s “just a library” that can be embedded in a Python process. pip install dlt and import dlt is all it takes.

An example use case is loading data from a REST API (the source) into a data warehouse (the destination) with a dlt pipeline that runs in a serverless cloud function (e.g. AWS Lambda).

What is Arrow?

Arrow is an Apache project that standardizes data analytics systems. Among other things, it specifies a format to represent analytics data in memory.

Format characteristics:

  • language agnostic → it’s the same in C++, Rust, Python, or any other language

  • columnar → values for a column are stored contiguously

  • lightweight encoding → no general purpose compression (e.g. Snappy) or complex encodings

  • O(1) (constant-time) random access

System interoperability and performance are two of the benefits of having this standard.

How dlt works

Before explaining how dlt uses Arrow, I will first describe how dlt works at a high level.

Pipeline steps

A basic dlt pipeline has three main steps:

  1. extract

  2. normalize

  3. load

extract → fetch data from source system and write to local disk

normalize → read extracted data from local disk infer schema and transform data in memory write transformed data to local disk

load → read normalized data from local disk and ingest into destination system

Extraction

extract is I/O intensive.

dlt uses a Python generator function that fetches data from a source system and yields it into the pipeline. This function is called a resource.

Normalization

Steps 1 and 3 of normalize are I/O intensive. Step 2 is compute intensive. Step 2 has several “substeps”:

  1. identify tables, columns and their data types

  2. apply naming convention (e.g. snake_case) to table and column identifiers

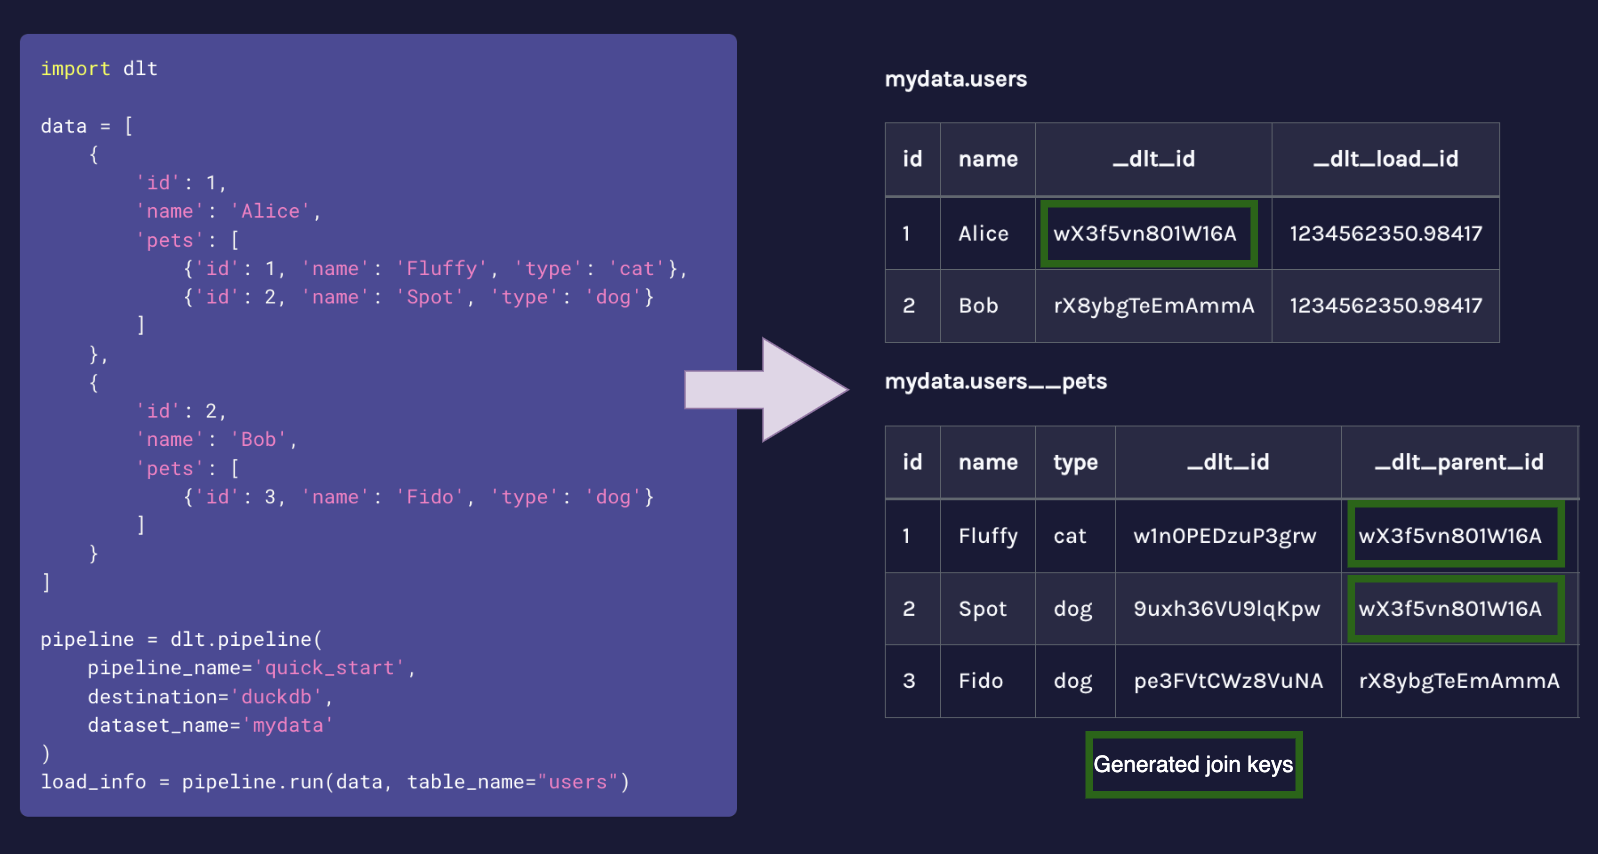
  3. add system columns → e.g. _dlt_id (row identifier) and _dlt_load_id (load identifier)

  4. split nested data into parent and child tables

Some of these substeps are already done during extract when using the Arrow route, as I explain later in this blog.

Loading

Load is I/O intensive (and in some cases also compute intensive).

The data files persisted during normalize are loaded into the destination. How this is done differs per destination.

How dlt uses Arrow

dlt currently supports two different pipeline “routes”:

  1. The traditional route → has existed since earliest versions of dlt

  2. The Arrow route → was added later as improvement

The user decides which route is taken. It’s an implicit choice that depends on the type of object yielded by the resource.
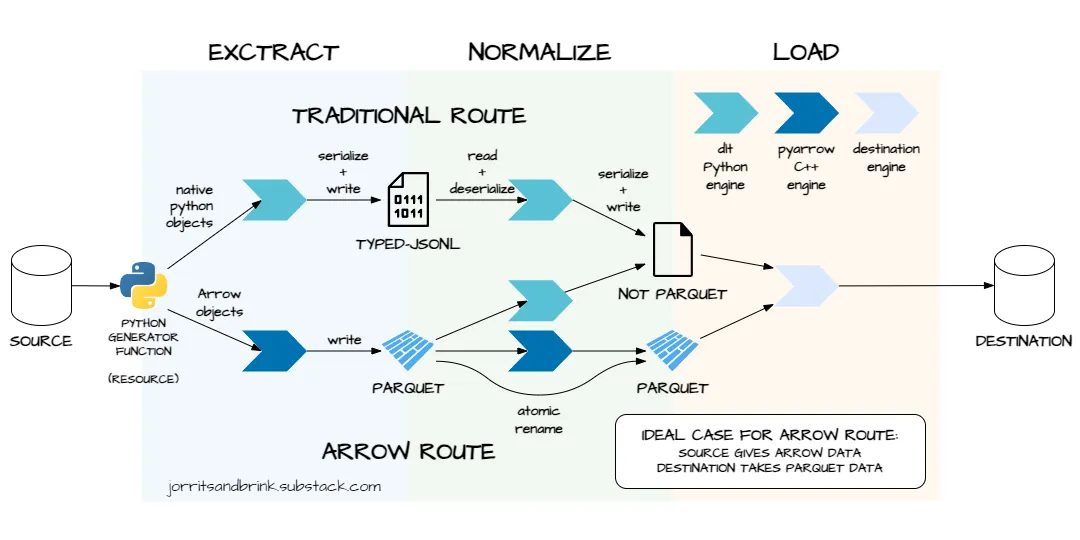
 Picture

Traditional route

The traditional route uses native Python objects and row orientation to represent tabular data in memory.
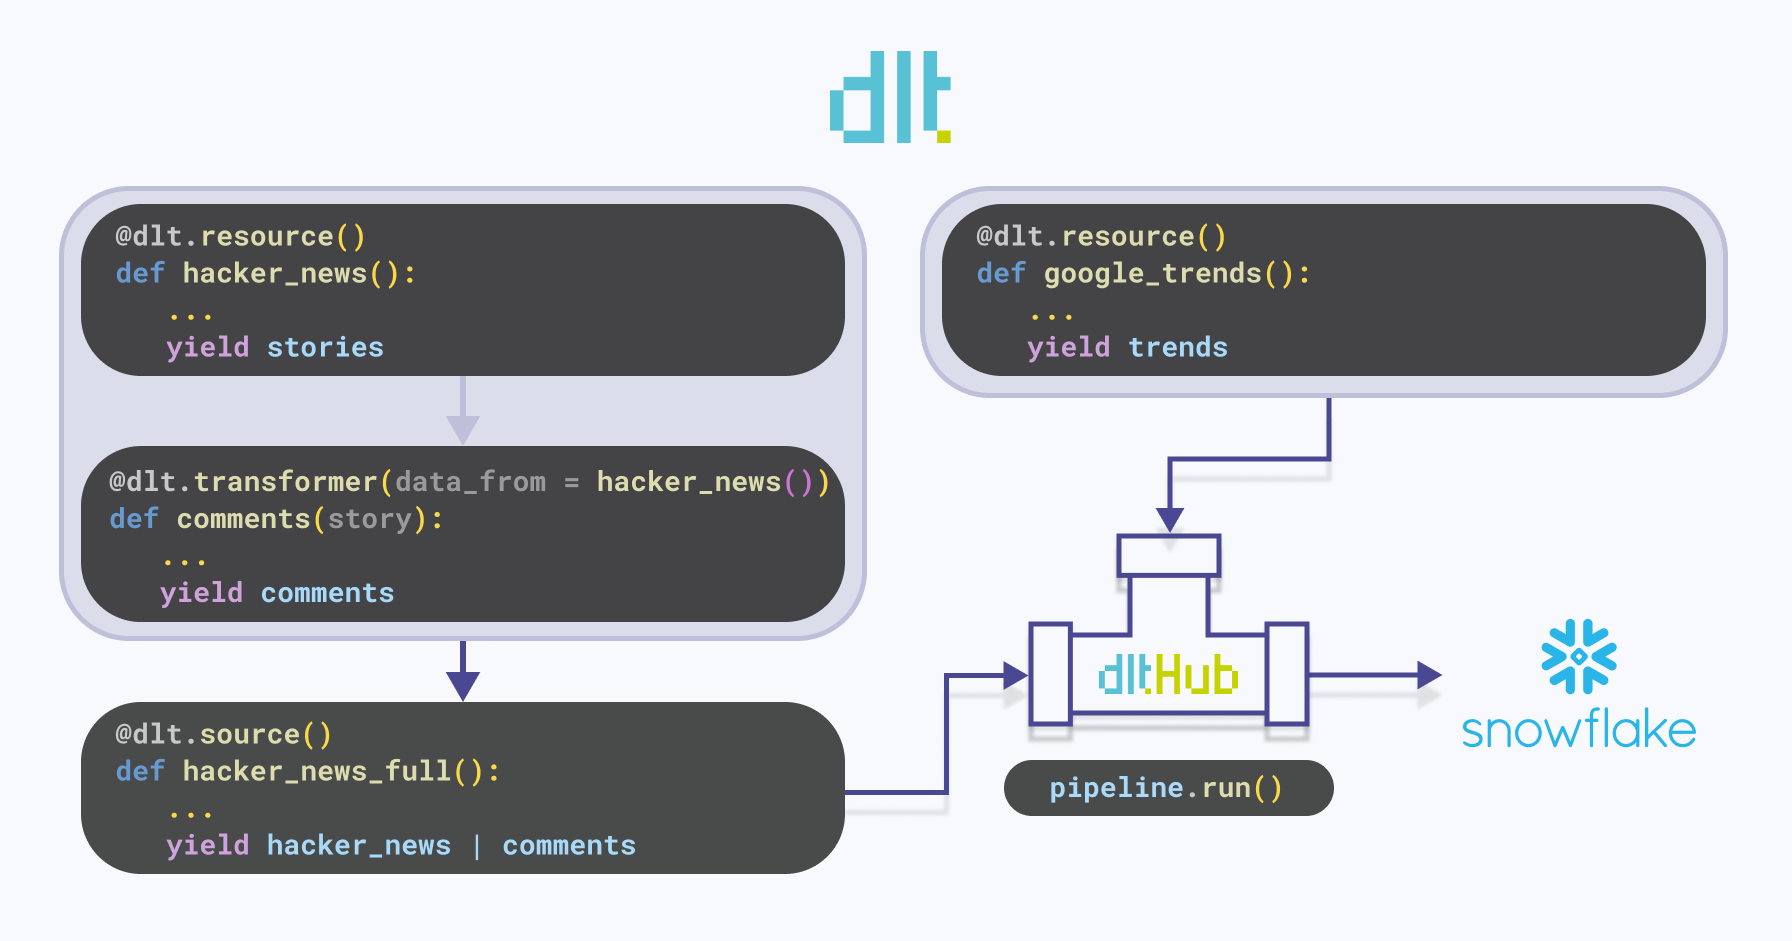
@dlt.resource
def my_traditional_resource():

# native Python objects as table
table = [
{"foo": 23, "bar": True},
{"foo": 7, "bar": False}
]

yield table

pipeline.run(my_traditional_resource())

extract

The resource yields Python dictionaries or lists of dictionaries into the pipeline. Each dictionary is a row: keys are column names, values are column values. A list of such dictionaries can be seen as a table.

The pipeline serializes the Python objects into a JSON-like byte-stream (using orjson) and persists to binary disk files with .typed-jsonl extension.

normalize

The pipeline reads the extracted data from .typed-jsonl files back into memory and deserializes it. It iterates over all table values in a nested for loop. The outer loop iterates over the rows, the inner loop iterates over the columns. While looping, the pipeline performs the steps mentioned in the paragraph called Normalization.

The normalized data is persisted to disk in a format that works well for the destination it will be loaded into. For example, two of the formats are:

  • jsonl → JSON Lines—default for filesystem destination

  • insert_values → a file storing INSERT SQL statements, compressed by default—default for some of the SQL destinations

load

As mentioned, this step differs per destination. It also depends on the format of the file persisted during normalize. Here are two examples to give an idea:

  • jsonl files and filesystem destination → use PUT operation

  • insert_values files and SQL destination (e.g. postgres) → execute SQL statements on SQL engine

Arrow route

The Arrow route uses columnar Arrow objects to represent tabular data in memory. It relies on the pyarrow Python libary.

import pyarrow as pa

@dlt.resource
def my_arrow_resource():

... # some process that creates a Pandas DataFrame

# Arrow object as table
table = pa.Table.from_pandas(df)

yield table

pipeline.run(my_arrow_resource())

extract

The resource yields Arrow objects into the pipeline. These can be Arrow tables (pyarrow.Table) or Arrow record batches (pyarrow.RecordBatch). Arrow objects are schema aware, meaning they store column names and data types alongside the data.

The pipeline serializes the Arrow objects into Parquet files on disk. This is done with pyarrow’s Parquet writer (pyarrow.parquet.ParquetWriter). Like Arrow objects, Parquet files are schema aware. The Parquet writer simply translates the Arrow schema to a Parquet schema and persists it in the file.

The yielded Arrow objects are slightly normalized in the extract step. This prevents a rewrite in the normalize step. The normalization done here are cheap metadata operations that don’t add much overhead to extract. For example, column names are adjusted if they don’t match the naming convention and column order is adjusted if it doesn’t match the table schema.

normalize

Schema inference is not needed because the table schema can be read from the Parquet file.

There are tree cases—in the ideal case, data does not need to be transformed:

  1. destination supports Parquet loading — no normalization (ideal): the extracted Parquet files are simply “moved” to the load folder using an atomic rename. This is a cheap metadata operation. Data is not transformed and the data doesn’t actually move. dlt does not add row and load identifier columns.

  2. destination supports Parquet loading — yes normalization (okay): the extracted Parquet files are loaded into memory in Arrow format. The necessary transformations (e.g. adding system columns or renaming column identifiers) are done using pyarrow methods. These operations are relatively cheap. Parquet and Arrow are both columnar and have similar data layouts. Transformations are done in batch, not on individual rows. Computations are done in C++, because pyarrow is a wrapper around the Arrow C++ library.

  3. destination does not support Parquet loading (not good): the extracted Parquet files are read in memory and converted to a format supported by the destination (e.g. insert_values). This is an expensive operation. Parquet’s columnar format needs to be converted to row orientation. The rows are iterated over one by one to generate the load file.

load

This step is the same as in the traditional route.

Main differences

The most important differences between the traditional and Arrow routes are as follows.

  • in memory format

    • traditional → native Python objects
    • Arrow → pyarrow objects
  • on disk format for normalized data

    • traditional → defaults to jsonl
    • Arrow → defaults to parquet
  • schema inference

    • traditional → handled by dlt during normalize—done in Python while iterating over rows
    • Arrow → two cases:
      • source system provides Arrow data: schema taken from source (no schema inference needed)
      • source system does not provide Arrow data: handled by pyarrow during extract when data is converted into Arrow objects, done in C++
  • data transformation for normalization

    • traditional → handled by dlt—done in Python while iterating over rows
    • Arrow → handled by pyarrow—done in C++ on columnar batches of rows

Why dlt uses Arrow

dlt uses Arrow to make pipelines faster. The normalize step in particular can be much more efficient in the Arrow route.

Using pyarrow objects for tabular data is faster than using native Python objects (lists of dictionaries), because they are:

  • schema aware

  • columnar

  • computed in C++

Generally speaking, C++ is much faster than Python. Moreover, Arrow’s C++ implementation can use vectorization (SIMD) thanks to the columnar data layout. The Arrow route can process batches of values concurrently in C++, while dlt’s traditional route needs iteration over values one by one in a nested Python loop.

Schema aware Arrow objects prevents dlt from having to infer column types from column values.

Further thoughts

A potential optimization I can think of (but haven’t tested) is to use the Arrow IPC File Format to serialize data between extract and normalize. This saves two format conversions:

  1. Arrow → Parquet (serialization at the end of extract)

  2. Parquet → Arrow (deserialization at the start of normalize)

Although Arrow and Parquet have relatively similar layouts (especially when using Parquet without general purpose compression), removing the (de)serialization steps might still improve performance significantly.

Simply disabling compression when writing the Parquet file could be an easier way to achieve similar results.

Context

I contribute to the open source dlt library, but didn’t implement the core framework logic related to extraction, normalization, and loading described in this post. I’m enthusiastic about Arrow and its implications for the data ecosystem, but haven’t contributed to their open source libraries.

Call to action

Try the SQL connector here with the various backends: Docs

Want to discuss performance? Join the dlt slack community!

· 4 min read
Aman Gupta

Why do we do it?

Hello, I'm Aman, and I assist the dlthub team with various data-related tasks. In a recent project, the Operations team needed to gather information through Google Forms and integrate it into a Notion database. Initially, they tried using the Zapier connector as a quick and cost-effective solution, but it didn’t work as expected. Since we’re at dlthub, where everyone is empowered to create pipelines, I stepped in to develop one that would automate this process.

The solution involved setting up a workflow to automatically sync data from Google Forms to a Notion database. This was achieved using Google Sheets, Google Apps Script, and a dlt pipeline, ensuring that every new form submission was seamlessly transferred to the Notion database without the need for manual intervention.

Implementation

So here are a few steps followed:

Step 1: Link Google Form to Google Sheet

Link the Google Form to a Google Sheet to save responses in the sheet. Follow Google's documentation for setup.

Step 2: Google Apps Script for Data Transfer

Create a Google Apps Script to send data from Google Sheets to a Notion database via a webhook. This script triggers every time a form response is saved.

Google Apps Script code:

function sendWebhookOnEdit(e) {
var sheet = SpreadsheetApp.getActiveSpreadsheet().getActiveSheet();
var range = sheet.getActiveRange();
var updatedRow = range.getRow();
var lastColumn = sheet.getLastColumn();
var headers = sheet.getRange(1, 1, 1, lastColumn).getValues()[0];
var updatedFields = {};
var rowValues = sheet.getRange(updatedRow, 1, 1, lastColumn).getValues()[0];

for (var i = 0; i < headers.length; i++) {
updatedFields[headers[i]] = rowValues[i];
}

var jsonPayload = JSON.stringify(updatedFields);
Logger.log('JSON Payload: ' + jsonPayload);

var url = 'https://your-webhook.cloudfunctions.net/to_notion_from_google_forms'; // Replace with your Cloud Function URL
var options = {
'method': 'post',
'contentType': 'application/json',
'payload': jsonPayload
};

try {
var response = UrlFetchApp.fetch(url, options);
Logger.log('Response: ' + response.getContentText());
} catch (error) {
Logger.log('Failed to send webhook: ' + error.toString());
}
}

Step 3: Deploying the ETL Pipeline

Deploy a dlt pipeline to Google Cloud Functions to handle data transfer from Google Sheets to the Notion database. The pipeline is triggered by the Google Apps Script.

  1. Create a Google Cloud function.
  2. Create main.py with the Python code below.
  3. Ensure requirements.txt includes dlt.
  4. Deploy the pipeline to Google Cloud Functions.
  5. Use the function URL in the Google Apps Script.
note

This pipeline uses @dlt.destination decorator which is used to set up custom destinations. Using custom destinations is a part of dlt's reverse ETL capabilities. To read more about dlt's reverse ETL pipelines, please read the documentation here.

Python code for main.py (Google cloud functions) :

import dlt
from dlt.common import json
from dlt.common.typing import TDataItems
from dlt.common.schema import TTableSchema
from datetime import datetime
from dlt.sources.helpers import requests

@dlt.destination(name="notion", batch_size=1, naming_convention="direct", skip_dlt_columns_and_tables=True)
def insert_into_notion(items: TDataItems, table: TTableSchema) -> None:
api_key = dlt.secrets.value # Add your notion API key to "secrets.toml"
database_id = "your_notion_database_id" # Replace with your Notion Database ID
url = "https://api.notion.com/v1/pages"
headers = {
"Authorization": f"Bearer {api_key}",
"Content-Type": "application/json",
"Notion-Version": "2022-02-22"
}

for item in items:
if isinstance(item.get('Timestamp'), datetime):
item['Timestamp'] = item['Timestamp'].isoformat()
data = {
"parent": {"database_id": database_id},
"properties": {
"Timestamp": {
"title": [{
"text": {"content": item.get('Timestamp')}
}]
},
# Add other properties here
}
}
response = requests.post(url, headers=headers, data=json.dumps(data))
print(response.status_code, response.text)

def your_webhook(request):
data = request.get_json()
Event = [data]

pipeline = dlt.pipeline(
pipeline_name='platform_to_notion',
destination=insert_into_notion,
dataset_name='webhooks',
full_refresh=True
)

pipeline.run(Event, table_name='webhook')
return 'Event received and processed successfully.'

Step 4: Automation and Real-Time updates

With everything set up, the workflow automates data transfer as follows:

  1. Form submission saves data in Google Sheets.
  2. Google Apps Script sends a POST request to the Cloud Function.
  3. The dlt pipeline processes the data and updates the Notion database.

Conclusion

We initially considered using Zapier for this small task, but ultimately, handling it ourselves proved to be quite effective. Since we already use an orchestrator for our other automations, the only expense was the time I spent writing and testing the code. This experience demonstrates that dlt is a straightforward and flexible tool, suitable for a variety of scenarios. Essentially, wherever Python can be used, dlt can be applied effectively for data loading, provided it meets your specific needs.

· 5 min read
Aman Gupta
info

Check this Colab Notebook for a short and sweet demo.

What is a slowly changing dimension?

Slowly changing dimensions are a dimensional modelling technique created for historising changes in data.

This technique only works if the dimensions change slower than we read the data, since we would not be able to track changes happening between reads. For example, if someone changes their address once in a blue moon, we will capture the changes with daily loads - but if they change their address 3x in a day, we will only see the last state and only capture 2 of the 4 versions of the address.

However, they enable you to track things you could not before such as

  • Hard deletes
  • Most of the changes and when they occurred
  • Different versions of entities valid at different historical times

What is Slowly Changing Dimension Type 2 (SCD2)? and why use it?

The Type 2 subtype of Slowly Changing Dimensions (SCD) manages changes in data over time. When data changes, a new record is added to the database, but the old record remains unchanged. Each record includes a timestamp or version number. This allows you to view both the historical data and the most current data separately.

Traditional data loading methods often involve updating existing records with new information, which results in the loss of historical data.

SCD2 not only preserves an audit trail of data changes but also allows for accurate historical analysis and reporting.

SCD2 applications

Colab demo

Use Case 1: Versioning a record that changes

In environments where maintaining a complete historical record of data changes is crucial, such as in financial services or healthcare, SCD Type 2 plays a vital role. For instance, if a customer's address changes, SCD2 ensures that the old address is preserved in historical records while the new address is available for current transactions. This ability to view the evolution of data over time supports auditing, tracking changes, and analyzing trends without losing the context of past information. It allows organizations to track the lifecycle of a data entity across different states.

Here's an example with the customer address change.

Before:

_dlt_valid_from_dlt_valid_tocustomer_keyc1c2
2024-04-09 18:27:53.734235NULL1123 Elm StTN

After update:

_dlt_valid_from_dlt_valid_tocustomer_keyc1c2
2024-04-09 18:27:53.7342352024-05-01 17:00:00.0000001123 Elm StTN
2024-05-02 08:00:00.000000NULL1456 Oak AveTN

In the updated state, the previous address record is closed with an _dlt_valid_to timestamp, and a new record is created with the new address "456 Oak Ave" effective from May 2, 2024. The NULL in the _dlt_valid_to field for this new record signifies that it is the current and active address.

Use Case 2: Tracking deletions

This approach ensures that historical data is preserved for audit and compliance purposes, even though the record is no longer active in the current dataset. It allows businesses to maintain integrity and a full historical trail of their data changes.

State Before Deletion: Customer Record Active

_dlt_valid_from_dlt_valid_tocustomer_keyc1c2
2024-04-09 18:27:53.734235NULL1123 Elm StTN

This table shows the customer record when it was active, with an address at "123 Elm St". The _dlt_valid_to field is NULL, indicating that the record is currently active.

State after deletion: Customer record marked as deleted

_dlt_valid_from_dlt_valid_tocustomer_keyc1c2
2024-04-09 18:27:53.7342352024-06-01 10:00:00.0000001123 Elm StTN

In this updated table, the record that was previously active is marked as deleted by updating the _dlt_valid_to field to reflect the timestamp when the deletion was recognized, in this case, June 1, 2024, at 10:00 AM. The presence of a non-NULL _dlt_valid_to date indicates that this record is no longer active as of that timestamp.

Learn how to customise your column names and validity dates in our SDC2 docs.

Surrogate keys, what are they? Why use?

Every record in the SCD2 table needs its own id. We call this a surrogate key. We use it to identify the specific record or version of an entity, and we can use it when joining to our fact tables for performance (as opposed to joining on entity id + validity time).

Simple steps to determine data loading strategy and write disposition

This decision flowchart helps determine the most suitable data loading strategy and write disposition:

  1. Is your data stateful? Stateful data is subject to change, like your age. Stateless data does not change, for example, events that happened in the past are stateless.

    1. If your data is stateless, such as logs, you can just increment by appending new logs.
    2. If it is stateful, do you need to track changes to it?
      1. If yes, then use SCD2 to track changes.
      2. If no,
        1. Can you extract it incrementally (new changes only)?
          1. If yes, load incrementally via merge.
          2. If no, re-load fully via replace.

Below is a visual representation of steps discussed above: Image

Conclusion

Use SCD2 where it makes sense but keep in mind the shortcomings related to the read vs update frequency. Use dlt to do it at loading and keep everything downstream clean and simple.

Want to discuss? Join the dlt slack community!

· 12 min read
Adrian Brudaru
info

TL;DR: dlt is a library for Normies: Problem solvers with antipathy for black boxes, gratuitous complexity and external dependencies.

This post tells the story of how we got here.

Try it in colab:

But if you want to load pandas dfs to production databases, with all the best practices built-in, check out this documentation or this colab notebook that shows easy handling of complex api data.

Or check out more resources at the end of the article

I. The background story: Normal people load data too

Hey, I’m Adrian, cofounder of dlt. I’ve been working in the data industry since 2012, doing all kinds of end-to-end things.

In 2017, a hiring team called me a data engineer. As I saw that title brought me a lot of work offers, I kept it and went with it.

But was I doing data engineering? Yes and no. Since my studies were not technical, I always felt some impostor syndrome calling myself a data engineer. I had started as an analyst, did more and more and became an end to end data professional that does everything from building the tech stack, collecting requirements, getting managers to agree on the metrics used 🙄, creating roadmap and hiring a team.

Back in 2022 there was an online conference called Normconf and I ‘felt seen’. As I watched Normconf participants, I could relate more to them than to the data engineer label. No, I am not just writing code and pushing best practices - I am actually just trying to get things done without getting bogged down in bad practice gotchas. And it seemed at this conference that many people felt this way.

normal

Normies: Problem solvers with antipathy for black boxes, gratuitous complexity and external dependencies

At Normconf, "normie" participants often embodied the three fundamental psychological needs identified in Self-Determination Theory: autonomy, competence, and relatedness.

They talked about how they autonomously solved all kinds of problems, related on the pains and gains of their roles, and showed off their competence across the board, in solving problems.

What they did, was what I also did as a data engineer: We start from a business problem, and work back through what needs to be done to understand and solve it.

By very definition, Normie is someone not very specialised at one thing or another, and in our field, even data engineers are jacks of all trades.

What undermines the Normie mission are things that clash with the basic needs, from uncustomisable products, to vendors that add bottlenecks and unreliable dependencies.

Encountering friction between data engineers and Python-first analysts

Before becoming a co-founder of dlt I had 5 interesting years as a startup employee, a half-year nightmare in a corporation with no autonomy or mastery (I got fired for refusing the madness, and it was such a huge relief), followed by 5 fun, rewarding and adventure-filled years of freelancing. Much of my work was “build&hire” which usually meant building a first time data warehouse and hiring a team for it. The setups that I did were bespoke to the businesses that were getting them, including the teams - Meaning, the technical complexity was also tailored to the (lack of) technical culture of the companies I was building for.

In this time, I saw an acute friction between data engineers and Python-first analysts, mostly around the fact that data engineers easily become a bottleneck and data scientists are forced to pick up the slack. And of course, this causes other issues that might further complicate the life of the data engineer, while still not being a good solution for the data consumers.

So at this point I started building boilerplate code for data warehouses and learning how to better cater to the entire team.

II. The initial idea: pandas.df.to_sql() with data engineering best practices

After a few attempts I ended up with the hypothesis that df.to_sql() is the natural abstraction a data person would use - I have a table here, I want a table there, shouldn’t be harder than a function call right?

Right.

Except that particular function call is anything but data engineering complete. A single run will do what it promises. A production pipeline will also have many additional requirements. In the early days, we wrote up an ideal list of features that should be auto-handled (spoiler alert: today dlt does all that and more). Read on for the wish list:

Our dream: a tool that meets production pipelines requirements

  • Wouldn’t it be nice if we could auto-flatten and unpack nested structures into tables with generated join keys?
  • Wouldn’t it be nice if data types were properly defined and managed?
  • Wouldn’t it be nice if we could load the data incrementally, meaning retain some state to know where to start from?
  • Wouldn’t it be nice if this incremental load was bound to a way to do incremental extraction?
  • Wouldn’t it be nice if we didn’t run out of memory?
  • Wouldn’t it be nice if we got alerted/notified when schemas change?
  • Wouldn’t it be nice if schema changes were self healing?
  • Wouldn’t it be nice if I could run it all in parallel, or do async calls?
  • Wouldn’t it be nice if it ran on different databases too, from dev to prod?
  • Wouldn’t it be nice if it offered requests with built in retries for those nasty unreliable apis (Hey Zendesk, why you fail on call 99998/100000?)
  • Wouldn’t it be nice if we had some extraction helpers like pagination detection?

Auto typing and unpacking with generated keys: keys

Performance docs

The initial steps

How did we go about it? At first dlt was created as an engine to iron out its functionality. During this time, it was deployed it in several projects, from startups to enterprises, particularly to accelerate data pipeline building in a robust way.

A while later, to prepare this engine for the general public, we created the current interface on top of it. We then tested it in a workshop with many “Normies” of which over 50% were pre-employment learners.

For the workshop we broke down the steps to build an incremental pipeline into 20 steps. In the 6 hour workshop we asked people to react on Slack to each “checkpoint”. We then exported the slack data and loaded it with dlt, exposing the completion rate per checkpoint. Turns out, it was 100%. Everyone who started, managed to build the pipeline. “This is it!” we thought, and spend the next 6 months preparing our docs and adding some plugins for easy deployment.

III. Launching dlt

We finally launched dlt mid 2023 to the general public. Our initial community was mostly data engineers who had been using dlt without docs, managing from reading code. As we hoped a lot of “normies” are using dlt, too!

dlt = code + docs + Slack support

A product is a sum of many parts. For us dlt is not only the dlt library and interface, but also our docs and Slack community and the support and discussions there.

In the early days of dlt we talked to Sebastian Ramirez from FastAPI who told us that he spends 2/3 of his FastAPI time writing documentation.

In this vein, from the beginning docs were very important to us and we quickly adopted our own docs standard.

However, when we originally launched dlt, we found that different user types, especially Normies, expect different things from our docs, and because we asked for feedback, they told us.

So overall, we were not satisfied to stop there.

"Can you make your docs more like my favorite tool's docs?"

To this end we built and embedded our own docs helper in our docs.

The result? The docs helper has been running for a year and we currently see around 300 questions per day. Comparing this to other communities that do AI support on Slack, that’s almost 2 orders of magnitude difference in question volume by community size.

We think this is a good thing, and a result of several factors.

  • Embedded in docs means at the right place at the right time. Available to anyone, whether they use Slack or not.
  • Conversations are private and anonymous. This reduces the emotional barrier of asking. We suspect this is great for the many “Normies” / “problem solvers” that work in data.
  • The questions are different than in our Slack community: Many questions are around “Setup and configuration”, “Troubleshooting” and “General questions” about dlt architecture. In Slack, we see the questions that our docs or assistant could not answer.
  • The bot is conversational and will remember recent context, enabling it to be particularly helpful. This is different from the “question answering service” that many Slack bots offer, which do not keep context once a question was answered. By retaining context, it’s possible to reach a useful outcome even if it doesn’t come in the first reply.

dlt = “pip install and go” - the fastest way to create a pipeline and source

dlt offers a small number of verified sources, but encourages you to build your own. As we mentioned, creating an ad hoc dlt pipeline and source is dramatically simpler compared to other python libraries. Maintaining a custom dlt source in production takes no time at all because the pipeline won't break unless the source stops existing.

The sources you build and run that are not shared back into the verified sources are what we call “private sources”.

By the end of 2023, our community had already built 1,000 private sources, 2,000 by early March. We are now at the end of q2 2024 and we see 5,000 private sources.

Embracing LLM-free code generation

We recently launched additional tooling that helps our users build sources. If you wish to try our python-first dict-based declarative approach to building sources, check out the relevant post.

  • Rest api connector
  • Openapi based pipeline generator that configures the rest api connector.

Alena introduces the generator and troubleshoots the outcome in 4min:

Community videos for rest api source: playlist.

Both tools are LLM-free pipeline generators. I stress LLM free, because in our experience, GPT can do some things to some extent - so if we ask it to complete 10 tasks to produce a pipeline, each having 50-90% accuracy, we can expect very low success rates.

To get around this problem, we built from the OpenAPI standard which contains information that can be turned into a pipeline algorithmically. OpenAPI is an Api spec that’s also used by FastAPI and constantly growing in popularity, with around 50% of apis currently supporting it.

By leveraging the data in the spec, we are able to have a basic pipeline. Our generator also infers some other pieces of information algorithmically to make the pipeline incremental and add some other useful details.

When generation doesn’t work

Of course, generation doesn’t always work but you can take the generated pipeline and make the final adjustments to have a standard REST API config-based pipeline that won’t suffer from code smells.

The benefit of minimalistic sources

The real benefit of this declarative source is not at building time - A declarative interface requires more upfront knowledge. Instead, by having this option, we enable minimalistic pipelines that anyone could maintain, including non coders or human-assisted LLMs. After all, LLMs are particularly proficient at translating configurations back and forth.

Want to influence us? we listen, so you’re welcome to discuss with us in our slack channel #4-discussions

Towards a paid offering

dlt is an open core product, meaning it won’t be gated to push you to the paid version at some point. Instead, much like Kafka and Confluent, we will offer things around dlt to help you leverage it in your context.

If you are interested to help us research what’s needed, you can apply for our design partnership program, that aims to help you deploy dlt, while helping us learn about your challenges.

Call to action.

If you like the idea of dlt, there is one thing that would help us:

Set aside 30min and try it.

See resource below.

We often hear variations of “oh i postponed dlt so long but it only took a few minutes to get going, wish I hadn’t installed [other tool] which took 2 weeks to set up properly and now we need to maintain or replace”, so don't be that guy.

Here are some notebooks and docs to open your appetite:

· 4 min read
Adrian Brudaru

Dear dltHub Community,

We are thrilled to announce the launch of our groundbreaking pipeline generator tool.

We call it dlt-init-openapi.

Just point it to an OpenAPI spec, select your endpoints, and you're done!

What's OpenAPI again?

OpenAPI is the world's most widely used API description standard. You may have heard about swagger docs? those are docs generated from the spec. In 2021 an information-security company named Assetnote scanned the web and unearthed 200,000 public OpenAPI files. Modern API frameworks like FastAPI generate such specifications automatically.

How does it work?

A pipeline is a series of datapoints or decisions about how to extract and load the data, expressed as code or config. I say decisions because building a pipeline can be boiled down to inspecting a documentation or response and deciding how to write the code.

Our tool does its best to pick out the necessary details and detect the rest to generate the complete pipeline for you.

The information required for taking those decisions comes from:

How well does it work?

This is something we are also learning about. We did an internal hackathon where we each built a few pipelines with this generator. In our experiments with APIs for which we had credentials, it worked pretty well.

However, we cannot undertake a big detour from our work to manually test each possible pipeline, so your feedback will be invaluable. So please, if you try it, let us know how well it worked - and ideally, add the spec you used to our repository.

What to do if it doesn't work?

Once a pipeline is created, it is a fully configurable instance of the REST API Source. So if anything did not go smoothly, you can make the final tweaks. You can learn how to adjust the generated pipeline by reading our REST API Source documentation.

Are we using LLMS under the hood?

No. This is a potential future enhancement, so maybe later.

The pipelines are generated algorithmically with deterministic outcomes. This way, we have more control over the quality of the decisions.

If we took an LLM-first approach, the errors would compound and put the burden back on the data person.

We are however considering using LLM-assists for the things that the algorithmic approach can't detect. Another avenue could be generating the OpenAPI spec from website docs. So we are eager to get feedback from you on what works and what needs work, enabling us to improve it.

Try it out now!

Video Walkthrough:

Colab demo - Load data from Stripe API to DuckDB using dlt and OpenAPI

Docs for dlt-init-openapi

dlt init openapi code repo.

Specs repository you can generate from.

Showcase your pipeline in the community sources **here

Next steps: Feedback, discussion and sharing.

Solving data engineering headaches in the open source is a team sport. We got this far with your feedback and help (especially on REST API source), and are counting on your continuous usage and engagement to steer our pushing of what's possible into uncharted, but needed directions.

So here's our call to action:

Thank you for being part of our community and for building the future of ETL together!

- dltHub Team

· 4 min read
Aman Gupta

Hello, I'm Aman Gupta. Over the past eight years, I have navigated the structured world of civil engineering, but recently, I have found myself captivated by data engineering. Initially, I knew how to stack bricks and build structural pipelines. But this newfound interest has helped me build data pipelines, and most of all, it was sparked by a workshop hosted by dlt.

info

dlt (data loading tool) is an open-source library that you can add to your Python scripts to load data from various and often messy data sources into well-structured, live datasets.

The dlt workshop took place in November 2022, co-hosted by Adrian Brudaru, my former mentor and co-founder of dlt.

An opportunity arose when another client needed data migration from FreshDesk to BigQuery. I crafted a basic pipeline version, initially designed to support my use case. Upon presenting my basic pipeline to the dlt team, Alena Astrakhatseva, a team member, generously offered to review it and refine it into a community-verified source.

image

My first iteration was straightforward—loading data in replace mode. While adequate for initial purposes, a verified source demanded features like pagination and incremental loading. To achieve this, I developed an API client tailored for the Freshdesk API, integrating rate limit handling and pagination:

class FreshdeskClient:
"""
Client for making authenticated requests to the Freshdesk API. It incorporates API requests with
rate limit and pagination.
"""

def __init__(self, api_key: str, domain: str):
# Contains stuff like domain, credentials and base URL.
pass

def _request_with_rate_limit(self, url: str, **kwargs: Any) -> requests.Response:
# Handles rate limits in HTTP requests and ensures that the client doesn't exceed the limit set by the server.
pass

def paginated_response(
self,
endpoint: str,
per_page: int,
updated_at: Optional[str] = None,
) -> Iterable[TDataItem]:
# Fetches a paginated response from a specified endpoint.
pass

To further make the pipeline effective, I developed dlt resources that could handle incremental data loading. This involved creating resources that used dlt's incremental functionality to fetch only new or updated data:

def incremental_resource(
endpoint: str,
updated_at: Optional[Any] = dlt.sources.incremental(
"updated_at", initial_value="2022-01-01T00:00:00Z"
),
) -> Generator[Dict[Any, Any], Any, None]:
"""
Fetches and yields paginated data from a specified API endpoint.
Each page of data is fetched based on the `updated_at` timestamp
to ensure incremental loading.
"""

# Retrieve the last updated timestamp to fetch only new or updated records.
updated_at = updated_at.last_value

# Use the FreshdeskClient instance to fetch paginated responses
yield from freshdesk.paginated_response(
endpoint=endpoint,
per_page=per_page,
updated_at=updated_at,
)

With the steps defined above, I was able to load the data from Freshdesk to BigQuery and use the pipeline in production. Here’s a summary of the steps I followed:

  1. Created a Freshdesk API token with sufficient privileges.
  2. Created an API client to make requests to the Freshdesk API with rate limit and pagination.
  3. Made incremental requests to this client based on the “updated_at” field in the response.
  4. Ran the pipeline using the Python script.

While my journey from civil engineering to data engineering was initially intimidating, it has proved to be a profound learning experience. Writing a pipeline with dlt mirrors the simplicity of a GET request: you request data, yield it, and it flows from the source to its destination. Now, I help other clients integrate dlt to streamline their data workflows, which has been an invaluable part of my professional growth.

In conclusion, diving into data engineering has expanded my technical skill set and provided a new lens through which I view challenges and solutions. As for me, the lens view mainly was concrete and steel a couple of years back, which has now begun to notice the pipelines of the data world.

Data engineering has proved both challenging, satisfying, and a good career option for me till now. For those interested in the detailed workings of these pipelines, I encourage exploring dlt's GitHub repository or diving into the documentation.

· 9 min read
Adrian Brudaru

What is the REST API Source toolkit?

tip

tl;dr: You are probably familiar with REST APIs.

  • Our new REST API Source is a short, declarative configuration driven way of creating sources.
  • Our new REST API Client is a collection of Python helpers used by the above source, which you can also use as a standalone, config-free, imperative high-level abstraction for building pipelines.

Want to skip to docs? Links at the bottom of the post.

Why REST configuration pipeline? Obviously, we need one!

But of course! Why repeat write all this code for requests and loading, when we could write it once and re-use it with different APIs with different configs?

Once you have built a few pipelines from REST APIs, you can recognise we could, instead of writing code, write configuration.

We can call such an obvious next step in ETL tools a “focal point” of “convergent evolution”.

And if you’ve been in a few larger more mature companies, you will have seen a variety of home-grown solutions that look similar. You might also have seen such solutions as commercial products or offerings.

But ours will be better…

So far we have seen many REST API configurators and products — they suffer from predictable flaws:

  • Local homebrewed flavors are local for a reason: They aren’t suitable for the broad audience. And often if you ask the users/beneficiaries of these frameworks, they will sometimes argue that they aren’t suitable for anyone at all.
  • Commercial products are yet another data product that doesn’t plug into your stack, brings black boxes and removes autonomy, so they simply aren’t an acceptable solution in many cases.

So how can dlt do better?

Because it can keep the best of both worlds: the autonomy of a library, the quality of a commercial product.

As you will see further, we created not just a standalone “configuration-based source builder” but we also expose the REST API client used enabling its use directly in code.

Hey community, you made us do it!

The push for this is coming from you, the community. While we had considered the concept before, there were many things dlt needed before creating a new way to build pipelines. A declarative extractor after all, would not make dlt easier to adopt, because a declarative approach requires more upfront knowledge.

Credits:

  • So, thank you Alex Butler for building a first version of this and donating it to us back in August ‘23: https://github.com/dlt-hub/dlt-init-openapi/pull/2.
  • And thank you Francesco Mucio and Willi Müller for re-opening the topic, and creating video tutorials.
  • And last but not least, thank you to dlt team’s Anton Burnashev (also known for gspread library) for building it out!

The outcome? Two Python-only interfaces, one declarative, one imperative.

  • dlt’s REST API Source is a Python dictionary-first declarative source builder, that has enhanced flexibility, supports callable passes, native config validations via python dictionaries, and composability directly in your scripts. It enables generating sources dynamically during runtime, enabling straightforward, manual or automated workflows for adapting sources to changes.
  • dlt’s REST API Client is the low-level abstraction that powers the REST API Source. You can use it in your imperative code for more automation and brevity, if you do not wish to use the higher level declarative interface.

Useful for those who frequently build new pipelines

If you are on a team with 2-3 pipelines that never change much you likely won’t see much benefit from our latest tool. What we observe from early feedback a declarative extractor is great at is enabling easier work at scale. We heard excitement about the REST API Source from:

  • companies with many pipelines that frequently create new pipelines,
  • data platform teams,
  • freelancers and agencies,
  • folks who want to generate pipelines with LLMs and need a simple interface.

How to use the REST API Source?

Since this is a declarative interface, we can’t make things up as we go along, and instead need to understand what we want to do upfront and declare that.

In some cases, we might not have the information upfront, so we will show you how to get that info during your development workflow.

Depending on how you learn better, you can either watch the videos that our community members made, or follow the walkthrough below.

Video walkthroughs

In these videos, you will learn at a leisurely pace how to use the new interface. Playlist link.

Workflow walkthrough: Step by step

If you prefer to do things at your own pace, try the workflow walkthrough, which will show you the workflow of using the declarative interface.

In the example below, we will show how to create an API integration with 2 endpoints. One of these is a child resource, using the data from the parent endpoint to make a new request.

Configuration Checklist: Before getting started

In the following, we will use the GitHub API as an example.

We will also provide links to examples from this Google Colab tutorial.

  1. Collect your api url and endpoints, Colab example:

    • An URL is the base of the request, for example: https://api.github.com/.
    • An endpoint is the path of an individual resource such as:
      • /repos/{OWNER}/{REPO}/issues;
      • or /repos/{OWNER}/{REPO}/issues/{issue_number}/comments which would require the issue number from the above endpoint;
      • or /users/{username}/starred etc.
  2. Identify the authentication methods, Colab example:

  3. Identify if you have any dependent request patterns such as first get ids in a list, then use id for requesting details. For GitHub, we might do the below or any other dependent requests. Colab example.:

    1. Get all repos of an org https://api.github.com/orgs/{org}/repos.
    2. Then get all contributors https://api.github.com/repos/{owner}/{repo}/contributors.
  4. How does pagination work? Is there any? Do we know the exact pattern? Colab example.

    • On GitHub, we have consistent pagination between endpoints that looks like this link_header = response.headers.get('Link', None).
  5. Identify the necessary information for incremental loading, Colab example:

    • Will any endpoints be loaded incrementally?
    • What columns will you use for incremental extraction and loading?
    • GitHub example: We can extract new issues by requesting issues after a particular time: https://api.github.com/repos/{repo_owner}/{repo_name}/issues?since={since}.

Configuration Checklist: Checking responses during development

  1. Data path:
  2. Unless you had full documentation at point 4 (which we did), you likely need to still figure out some details on how pagination works.
    1. To do that, we suggest using curl or a second python script to do a request and inspect the response. This gives you flexibility to try anything. Colab example.
    2. Or you could print the source as above - but if there is metadata in headers etc, you might miss it.

Applying the configuration

Here’s what a configured example could look like:

  1. Base URL and endpoints.
  2. Authentication.
  3. Pagination.
  4. Incremental configuration.
  5. Dependent resource (child) configuration.

If you are using a narrow screen, scroll the snippet below to look for the numbers designating each component (n).

# This source has 2 resources:
# - issues: Parent resource, retrieves issues incl. issue number
# - issues_comments: Child resource which needs the issue number from parent.

import os
from rest_api import RESTAPIConfig

github_config: RESTAPIConfig = {
"client": {
"base_url": "https://api.github.com/repos/dlt-hub/dlt/", #(1)
# Optional auth for improving rate limits
# "auth": { #(2)
# "token": os.environ.get('GITHUB_TOKEN'),
# },
},
# The paginator is autodetected, but we can pass it explicitly #(3)
# "paginator": {
# "type": "header_link",
# "next_url_path": "paging.link",
# }
# We can declare generic settings in one place
# Our data is stateful so we load it incrementally by merging on id
"resource_defaults": {
"primary_key": "id", #(4)
"write_disposition": "merge", #(4)
# these are request params specific to GitHub
"endpoint": {
"params": {
"per_page": 10,
},
},
},
"resources": [
# This is the first resource - issues
{
"name": "issues",
"endpoint": {
"path": "issues", #(1)
"params": {
"sort": "updated",
"direction": "desc",
"state": "open",
"since": {
"type": "incremental", #(4)
"cursor_path": "updated_at", #(4)
"initial_value": "2024-01-25T11:21:28Z", #(4)
},
}
},
},
# Configuration for fetching comments on issues #(5)
# This is a child resource - as in, it needs something from another
{
"name": "issue_comments",
"endpoint": {
"path": "issues/{issue_number}/comments", #(1)
# For child resources, you can use values from the parent resource for params.
"params": {
"issue_number": {
# Use type "resolve" to define child endpoint wich should be resolved
"type": "resolve",
# Parent endpoint
"resource": "issues",
# The specific field in the issues resource to use for resolution
"field": "number",
}
},
},
# A list of fields, from the parent resource, which will be included in the child resource output.
"include_from_parent": ["id"],
},
],
}

And that’s a wrap — what else should you know?

  • As we mentioned, there’s also a REST Client - an imperative way to use the same abstractions, for example, the auto-paginator - check out this runnable snippet:

    from dlt.sources.helpers.rest_client import RESTClient

    # Initialize the RESTClient with the Pokémon API base URL
    client = RESTClient(base_url="https://pokeapi.co/api/v2")

    # Using the paginate method to automatically handle pagination
    for page in client.paginate("/pokemon"):
    print(page)
  • We are going to generate a bunch of sources from OpenAPI specs — stay tuned for an update in a couple of weeks!

Next steps

· 12 min read
Anuun Chinbat

It's been nearly half a century since cron was first introduced, and now we have a handful orchestration tools that go way beyond just scheduling tasks. With data folks constantly debating about which tools are top-notch and which ones should leave the scene, it's like we're at a turning point in the evolution of these tools. By that I mean the term 'orchestrator' has become kind of a catch-all, and that's causing some confusion because we're using this one word to talk about a bunch of different things.

dates

Think about the word “date.” It can mean a fruit, a romantic outing, or a day on the calendar, right? We usually figure out which one it is from the context, but what does context mean when it comes to orchestration? It might sound like a simple question, but it's pretty important to get this straight.

And here's a funny thing: some people, after eating an odd-tasting date (the fruit, of course), are so put off that they naively swear off going on romantic dates altogether. It's an overly exaggerated figurative way of looking at it, but it shows how one bad experience can color our view of something completely different. That's kind of what's happening with orchestration tools. If someone had a bad time with one tool, they might be overly critical towards another, even though it might be a totally different experience.

So the context in terms of orchestration tools seems to be primarily defined by one thing - WHEN a specific tool was first introduced to the market (aside from the obvious factors like the technical background of the person discussing these tools and their tendency to be a chronic complainer 🙄).


IT'S ALL ABOUT TIMING!

evolution-of-data-orchestration

The Illegitimate Child

Cron was initially released in 1975 and is undoubtedly the father of all scheduling tools, including orchestrators, but I’m assuming Cron didn’t anticipate this many offspring in the field of data (or perhaps it did). As Oracle brought the first commercial relational database to market in 1979, people started to realize that data needs to be moved on schedule, and without manual effort. And it was doable, with the help of Control-M, though it was more of a general workflow automation tool that didn’t pay special attention to data workflows.

Basically, since the solutions weren’t data driven at that time, it was more “The job gets done, but without a guarantee of data quality.”

Finally Adopted

Unlike Control-M, Informatica was designed for data operations in mind from the beginning. As data started to spread across entire companies, advanced OLAPs started to emerge with a broad use of datawarehousing. Now data not only needed to be moved, but integrated across many systems and users. The data orchestration solution from Informatica was inevitably influenced by the rising popularity of the contemporary drag-and-drop concept, that is, to the detriment of many modern data engineers who would recommend to skip Informatica and other GUI based ETL tools that offer ‘visual programming’.

As the creator of Airflow, Max Beauchemin, said: “There's a multitude of reasons why complex pieces of software are not developed using drag and drop tools: it's that ultimately code is the best abstraction there is for software.

To Be Free, That Is, Diverse

With traditional ETL tools, such as IBM DataStage and Talend, becoming well-established in the 1990s and early 2000s, the big data movement started gaining its momentum with Hadoop as the main star. Oozie, later made open-source in 2011, was tasked with workflow scheduling of Hadoop jobs, with closed-source solutions, like K2View starting to operate behind the curtains.

Fast forward a bit, and the scene exploded, with Airflow quickly becoming the heavyweight champ, while every big data service out there began rolling out their own orchestrators. This burst brought diversity, but with diversity came a maze of complexity. All of a sudden, there’s an orchestrator for everyone — whether you’re chasing features or just trying to make your budget work 👀 — picking the perfect one for your needs has gotten even trickier.

types

The Bottom Line

The thing is that every tool out there has some inconvenient truths, and real question isn't about escaping the headache — it's about choosing your type of headache. Hence, the endless sea of “versus” articles, blog posts, and guides trying to help you pick your personal battle.

A Redditor: “Everyone has hated all orchestration tools for all time. People just hated Airflow less and it took off.“

What I'm getting at is this: we're all a bit biased by the "law of the instrument." You know, the whole “If all you have is a hammer, everything looks like a nail” thing. Most engineers probably grabbed the latest or most hyped tool when they first dipped their toes into data orchestration and have stuck with it ever since. Sure, Airflow is the belle of the ball for the community, but there's a whole lineup of contenders vying for the spotlight.

law-of-instrument

And there are obviously those who would relate to the following:

reddit-screenshot


A HANDY DETOUR POUR TOI 💐

The Fundamentals

About Airflow

Miscellaneous


WHAT THE FUTURE HOLDS...

I'm no oracle or tech guru, but it's pretty obvious that at their core, most data orchestration tools are pretty similar. They're like building blocks that can be put together in different ways—some features come, some go, and users are always learning something new or dropping something old. So, what's really going to make a difference down the line is NOT just about having the coolest features. It's more about having a strong community that's all in on making the product better, a welcoming onboarding process that doesn't feel like rocket science, and finding that sweet spot between making things simple to use and letting users tweak things just the way they like.

In other words, it's not just about what the tools can do, but how people feel about using them, learning them, contributing to them, and obviously how much they spend to maintain them. That's likely where the future winners in the data orchestration game will stand out. But don’t get me wrong, features are important — it's just that there are other things equally important.


I’ve been working on this article for a WHILE now, and, honestly, it's been a bit of a headache trying to gather any solid, objective info on which data orchestration tool tops the charts. The more I think about it, the more I realise it's probably because trying to measure "the best" or "most popular" is a bit like trying to catch smoke with your bare hands — pretty subjective by nature. Plus, only testing them with non-production level data probably wasn't my brightest move.

However, I did create a fun little project where I analysed the sentiment of comments on articles about selected data orchestrators on Hacker News and gathered Google Trends data for the past year.

Just a heads-up, though: the results are BY NO MEANS reliable and are skewed due to some fun with words. For instance, searching for “Prefect” kept leading me to articles about Japanese prefectures, “Keboola” resulted in Kool-Aid content, and “Luigi”... well, let’s just say I ran into Mario’s brother more than once 😂.


THE FUN LITTLE PROJECT

Straight to the GitHub repo.

I used Dagster and dlt to load data into Snowflake, and since both of them have integrations with Snowflake, it was easy to set things up and have them all running:

Pipeline overview

This project is very minimal, including just what's needed to run Dagster locally with dlt. Here's a quick breakdown of the repo’s structure:

  1. .dlt: Utilized by the dlt library for storing configuration and sensitive information. The Dagster project is set up to fetch secret values from this directory as well.
  2. charts: Used to store chart images generated by assets.
  3. dlt_dagster_snowflake_demo: Your Dagster package, comprising Dagster assets, dlt resources, Dagster resources, and general project configurations.

Dagster Resources Explained

In the resources folder, the following two Dagster resources are defined as classes:

  1. DltPipeline: This is our dlt object defined as a Dagster ConfigurableResource that creates and runs a dlt pipeline with the specified data and table name. It will later be used in our Dagster assets to load data into Snowflake.

    class DltPipeline(ConfigurableResource):
    # Initialize resource with pipeline details
    pipeline_name: str
    dataset_name: str
    destination: str

    def create_pipeline(self, resource_data, table_name):
    """
    Creates and runs a dlt pipeline with specified data and table name.

    Args:
    resource_data: The data to be processed by the pipeline.
    table_name: The name of the table where data will be loaded.

    Returns:
    The result of the pipeline execution.
    """

    # Configure the dlt pipeline with your destination details
    pipeline = dlt.pipeline(
    pipeline_name=self.pipeline_name,
    destination=self.destination,
    dataset_name=self.dataset_name
    )

    # Run the pipeline with your parameters
    load_info = pipeline.run(resource_data, table_name=table_name)
    return load_info
  2. LocalFileStorage: Manages the local file storage, ensuring the storage directory exists and allowing data to be written to files within it. It will be later used in our Dagster assets to save images into the charts folder.

dlt Explained

In the dlt folder within dlt_dagster_snowflake_demo, necessary dlt resources and sources are defined. Below is a visual representation illustrating the functionality of dlt:

dlt explained

  1. hacker_news: A dlt resource that yields stories related to specified orchestration tools from Hackernews. For each tool, it retrieves the top 5 stories that have at least one comment. The stories are then appended to the existing data.

    Note that the write_disposition can also be set to merge or replace:

    • The merge write disposition merges the new data from the resource with the existing data at the destination. It requires a primary_key to be specified for the resource. More details can be found here.
    • The replace write disposition replaces the data in the destination with the data from the resource. It deletes all the classes and objects and recreates the schema before loading the data.

    More details can be found here.

  2. comments: A dlt transformer - a resource that receives data from another resource. It fetches comments for each story yielded by the hacker_news function.

  3. hacker_news_full: A dlt source that extracts data from the source location using one or more resource components, such as hacker_news and comments. To illustrate, if the source is a database, a resource corresponds to a table within that database.

  4. google_trends: A dlt resource that fetches Google Trends data for specified orchestration tools. It attempts to retrieve the data multiple times in case of failures or empty responses. The retrieved data is then appended to the existing data.

As you may have noticed, the dlt library is designed to handle the unnesting of data internally. When you retrieve data from APIs like Hacker News or Google Trends, dlt automatically unpacks the nested structures into relational tables, creating and linking child and parent tables. This is achieved through unique identifiers (_dlt_id and _dlt_parent_id) that link child tables to specific rows in the parent table. However, it's important to note that you have control over how this unnesting is done.

The Results

Alright, so once you've got your Dagster assets all materialized and data loaded into Snowflake, let's take a peek at what you might see:

sentiment counts

I understand if you're scratching your head at first glance, but let me clear things up. Remember those sneaky issues I mentioned with Keboola and Luigi earlier? Well, I've masked their charts with the respective “culprits”.

Now, onto the bars. Each trio of bars illustrates the count of negative, neutral, and positive comments on articles sourced from Hacker News that have at least one comment and were returned when searched for a specific orchestration tool, categorized accordingly by the specific data orchestration tool.

What's the big reveal? It seems like Hacker News readers tend to spread more positivity than negativity, though neutral comments hold their ground.

And, as is often the case with utilizing LLMs, this data should be taken with a grain of salt. It's more of a whimsical exploration than a rigorous analysis. However, if you take a peek behind Kool Aid and Luigi, it's intriguing to note that articles related to them seem to attract a disproportionate amount of negativity. 😂


IF YOU'RE STILL HERE

… and you're just dipping your toes into the world of data orchestration, don’t sweat it. It's totally normal if it doesn't immediately click for you. For beginners, it can be tricky to grasp because in small projects, there isn't always that immediate need for things to happen "automatically" - you build your pipeline, run it once, and then bask in the satisfaction of your results - just like I did in my project. However, if you start playing around with one of these tools now, it could make it much easier to work with them later on. So, don't hesitate to dive in and experiment!

… And hey, if you're a seasoned pro about to drop some knowledge bombs, feel free to go for it - because what doesn’t challenge us, doesn’t change us 🥹. (*Cries in Gen Z*)

· 3 min read
Adrian Brudaru

About Yummy.eu

Yummy is a Lean-ops meal-kit company streamlines the entire food preparation process for customers in emerging markets by providing personalized recipes, nutritional guidance, and even shopping services. Their innovative approach ensures a hassle-free, nutritionally optimized meal experience, making daily cooking convenient and enjoyable.

Yummy is a food box business. At the intersection of gastronomy and logistics, this market is very competitive. To make it in this market, Yummy needs to be fast and informed in their operations.

Pipelines are not yet a commodity.

At Yummy, efficiency and timeliness are paramount. Initially, Martin, Yummy’s CTO, chose to purchase data pipelining tools for their operational and analytical needs, aiming to maximize time efficiency. However, the real-world performance of these purchased solutions did not meet expectations, which led to a reassessment of their approach.

What’s important: Velocity, Reliability, Speed, time. Money is secondary.

Martin was initially satisfied with the ease of setup provided by the SaaS services.

The tipping point came when an update to Yummy’s database introduced a new log table, leading to unexpectedly high fees due to the vendor’s default settings that automatically replicated new tables fully on every refresh. This situation highlighted the need for greater control over data management processes and prompted a shift towards more transparent and cost-effective solutions.

10x faster, 182x cheaper with dlt + async + modal

Motivated to find a solution that balanced cost with performance, Martin explored using dlt, a tool known for its simplicity in building data pipelines. By combining dlt with asynchronous operations and using Modal for managed execution, the improvements were substantial:

  • Data processing speed increased tenfold.
  • Cost reduced by 182 times compared to the traditional SaaS tool.
  • The new system supports extracting data once and writing to multiple destinations without additional costs.

For a peek into on how Martin implemented this solution, please see Martin's async Postgres source on GitHub..

salo-martin-tweet

Taking back control with open source has never been easier

Taking control of your data stack is more accessible than ever with the broad array of open-source tools available. SQL copy pipelines, often seen as a basic utility in data management, do not generally differ significantly between platforms. They perform similar transformations and schema management, making them a commodity available at minimal cost.

SQL to SQL copy pipelines are widespread, yet many service providers charge exorbitant fees for these simple tasks. In contrast, these pipelines can often be set up and run at a fraction of the cost—sometimes just the price of a few coffees.

At dltHub, we advocate for leveraging straightforward, freely available resources to regain control over your data processes and budget effectively.

Setting up a SQL pipeline can take just a few minutes with the right tools. Explore these resources to enhance your data operations:

For additional support or to connect with fellow data professionals, join our community.

· 4 min read
Adrian Brudaru

Statistical Data and Metadata eXchange (SDMX) is an international standard used extensively by global organizations, government agencies, and financial institutions to facilitate the efficient exchange, sharing, and processing of statistical data.

Utilizing SDMX enables seamless integration and access to a broad spectrum of statistical datasets covering economics, finance, population demographics, health, and education, among others.

These capabilities make it invaluable for creating robust, data-driven solutions that rely on accurate and comprehensive data sources.

embeddable etl

Why SDMX?

SDMX not only standardizes data formats across disparate systems but also simplifies the access to data provided by institutions such as Eurostat, the ECB (European Central Bank), the IMF (International Monetary Fund), and many national statistics offices.

This standardization allows data engineers and scientists to focus more on analyzing data rather than spending time on data cleaning and preparation.

Installation and Basic Usage

To start integrating SDMX data sources into your Python applications, install the sdmx library using pip:

pip install sdmx1

Here's an example of how to fetch data from multiple SDMX sources, illustrating the diversity of data flows and the ease of access:

from sdmx_source import sdmx_source

source = sdmx_source([
{"data_source": "ESTAT", "dataflow": "PRC_PPP_IND", "key": {"freq": "A", "na_item": "PLI_EU28", "ppp_cat": "A0101", "geo": ["EE", "FI"]}, "table_name": "food_price_index"},
{"data_source": "ESTAT", "dataflow": "sts_inpr_m", "key": "M.PROD.B-D+C+D.CA.I15+I10.EE"},
{"data_source": "ECB", "dataflow": "EXR", "key": {"FREQ": "A", "CURRENCY": "USD"}}
])
print(list(source))

This configuration retrieves data from:

  • Eurostat (ESTAT) for the Purchasing Power Parity (PPP) and Price Level Indices providing insights into economic factors across different regions.
  • Eurostat's short-term statistics (sts_inpr_m) on industrial production, which is crucial for economic analysis.
  • European Central Bank (ECB) for exchange rates, essential for financial and trade-related analyses.

Loading the data with dlt, leveraging best practices

After retrieving data using the sdmx library, the next challenge is effectively integrating this data into databases. The dlt library excels in this area by offering a robust solution for data loading that adheres to best practices in several key ways:

  • Automated schema management -> dlt infers types and evolves schema as needed. It automatically handles nested structures too. You can customise this behavior, or turn the schema into a data contract.
  • Declarative configuration -> You can easily switch between write dispositions (append/replace/merge) or destinations.
  • Scalability -> dlt is designed to handle large volumes of data efficiently, making it suitable for enterprise-level applications and high-volume data streams. This scalability ensures that as your data needs grow, your data processing pipeline can grow with them without requiring significant redesign or resource allocation.

Martin Salo, CTO at Yummy, a food logistics company, uses dlt to efficiently manage complex data flows from SDMX sources. By leveraging dlt, Martin ensures that his data pipelines are not only easy to build, robust and error-resistant but also optimized for performance and scalability.

View Martin Salo's implementation

Martin Salo's implementation of the sdmx_source package effectively simplifies the retrieval of statistical data from diverse SDMX data sources using the Python sdmx library. The design is user-friendly, allowing both simple and complex data queries, and integrates the results directly into pandas DataFrames for immediate analysis.

This implementation enhances data accessibility and prepares it for analytical applications, with built-in logging and error handling to improve reliability.

Conclusion

Integrating sdmx and dlt into your data pipelines significantly enhances data management practices, ensuring operations are robust, scalable, and efficient. These tools provide essential capabilities for data professionals looking to seamlessly integrate complex statistical data into their workflows, enabling more effective data-driven decision-making.

By engaging with the data engineering community and sharing strategies and insights on effective data integration, data engineers can continue to refine their practices and achieve better outcomes in their projects.

Join the conversation and share your insights in our Slack community.

This demo works on codespaces. Codespaces is a development environment available for free to anyone with a Github account. You'll be asked to fork the demo repository and from there the README guides you with further steps.
The demo uses the Continue VSCode extension.

Off to codespaces!

DHelp

Ask a question

Welcome to "Codex Central", your next-gen help center, driven by OpenAI's GPT-4 model. It's more than just a forum or a FAQ hub – it's a dynamic knowledge base where coders can find AI-assisted solutions to their pressing problems. With GPT-4's powerful comprehension and predictive abilities, Codex Central provides instantaneous issue resolution, insightful debugging, and personalized guidance. Get your code running smoothly with the unparalleled support at Codex Central - coding help reimagined with AI prowess.